RRADIO BLACKOUT
R—Reading X-rays…
HELIOPHYSICS · OPERATIONAL DATA
Follow the full space-weather chain: eruptions, X-rays, solar wind, interplanetary magnetic field, magnetosphere, aurora and communication impacts.
The NOAA scales distinguish radio blackouts R, solar radiation storms S and geomagnetic storms G. They do not describe the same mechanism.
Reading X-rays…
Reading protons…
Reading Earth’s field…
Three wavelengths reveal different structures. These are near-real-time images, generally updated by SDO every fifteen minutes.
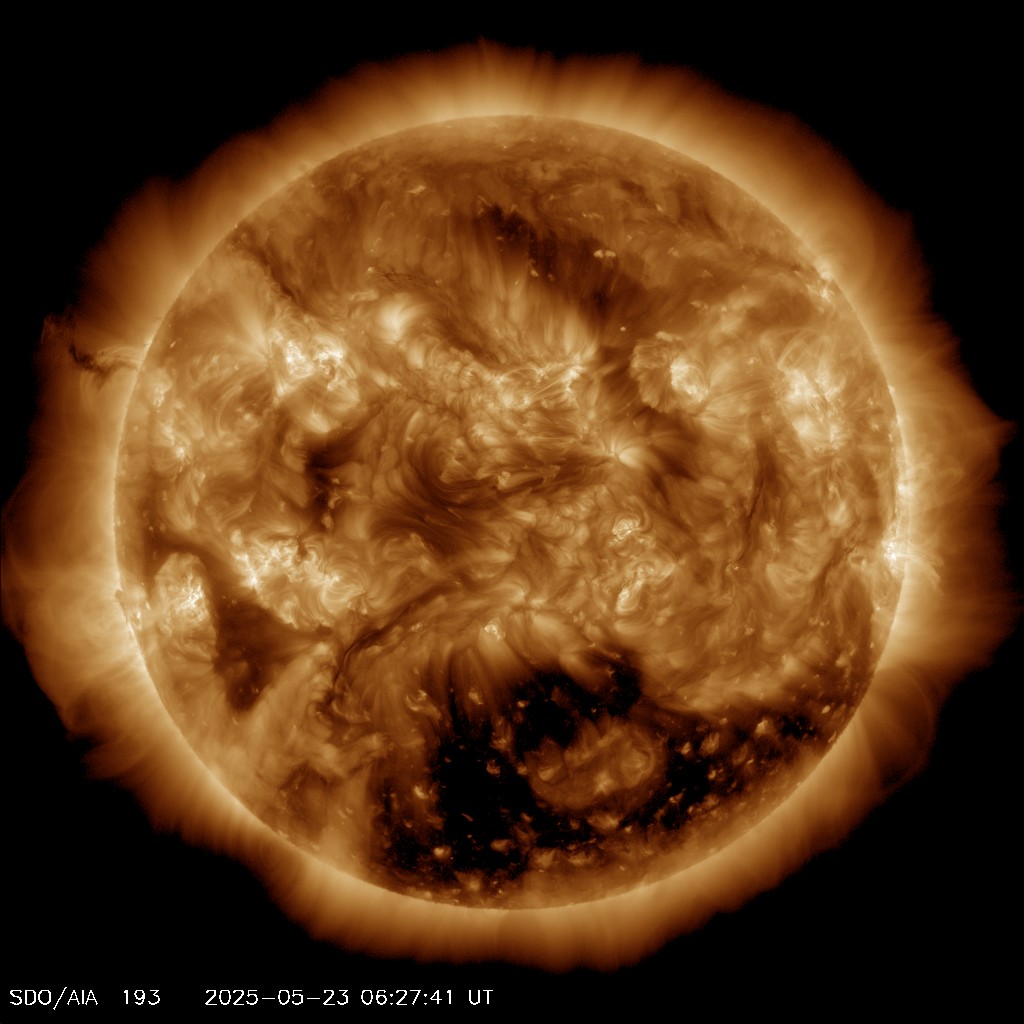
Large dark regions can identify coronal holes, possible sources of high-speed solar-wind streams.
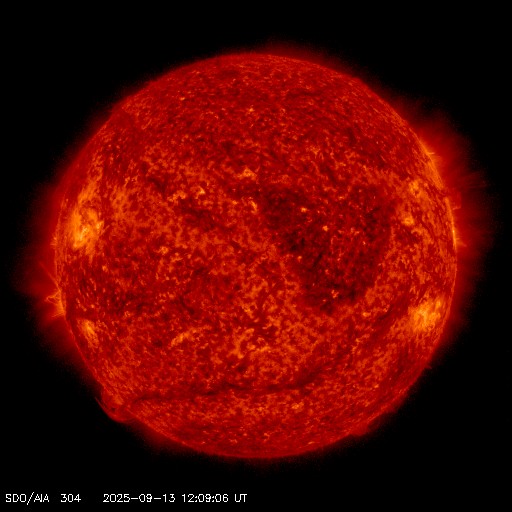
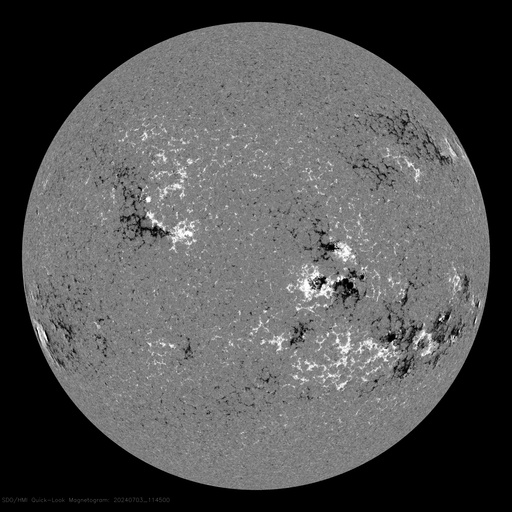
Images: courtesy of NASA/SDO and the AIA, EVE and HMI science teams. A missing image indicates a source outage, not an absence of solar activity.
X-rays from a flare reach Earth in about eight minutes. They ionize the sunlit hemisphere and can suddenly absorb HF signals in the D layer.
Reading the GOES sensor…
Each letter is a factor of ten. An X1 flare produces ten times the X-ray flux of an M1 flare.
Reading NOAA-numbered regions…
Spacecraft near the L1 Lagrange point sample the plasma before it reaches Earth. Speed, density and especially negative Bz determine how efficiently energy can enter the magnetosphere.
—
Potential dynamic pressure
Interplanetary plasma
IMF magnitude
—
At measured speed
The L1 lead time is a geometric estimate, not an alert. A CME requires analysis of its direction, speed and magnetic structure; space weather can never be reduced to one number.
The dayside is compressed by solar wind while the magnetotail stretches far behind Earth. When the interplanetary field points south, magnetic reconnection transfers energy more efficiently.
Calculating magnetospheric response…
The OVATION model estimates northern-lights probability in the Northern Hemisphere. Particles follow field lines toward the pole and excite oxygen and nitrogen in the upper atmosphere.
The dominant 557.7 nm emission, often around 100–150 km altitude.
The 630.0 nm emission, higher in the thermosphere and often more diffuse.
Molecular emissions associated with more energetic particles and lower altitudes.
The outlook combines F10.7 radio flux and the geomagnetic ap index. NOAA watches, alerts and warnings take precedence when an event is detected.
A probability describes risk over a period, not the exact time of an event.
Reading official messages…
Canada’s high latitudes make some infrastructure more sensitive. Effects vary with time, latitude, frequency and signal path.
X-rays strengthen the D layer on the dayside and increase absorption. Geomagnetic storms can degrade or move ionospheric paths for hours.
Total electron-content gradients and ionospheric scintillation can cause delays, position errors and temporary loss of lock.
Energetic particles, charging, electronic errors and upper-atmosphere expansion can disrupt electronics and increase drag in low Earth orbit.
Rapid geomagnetic variations induce currents in long infrastructure. Quebec suffered a major blackout during the March 1989 storm.
No single index is sufficient. A sound reading connects the solar source, travel time, magnetic orientation and ionospheric response.
Fields in active regions twist and store energy. Reconfiguration can produce a flare, a CME or both.
Light and X-rays arrive in 8 min 20 s; energetic particles in tens of minutes to hours; a CME generally in one to several days.
Upstream observatories measure speed, density and IMF before impact. Southward Bz favours reconnection with Earth’s field.
Dayside compression, energy storage in the tail, auroral currents and the ring current alter the field measured at ground level.
Deposited energy changes ionization, produces aurora and disturbs radio propagation, navigation and some electrical systems.
A burst of electromagnetic radiation. Its GOES class A, B, C, M or X is based on 0.1–0.8 nm soft X-ray flux; each letter is ten times the previous class.
A massive cloud of magnetized plasma. Only CMEs whose path intersects Earth can cause a major geomagnetic impact.
A region of open magnetic field in the corona. It can feed a high-speed stream and cause recurring activity with solar rotation.
A quasi-logarithmic planetary index from 0 to 9 calculated over three hours from several observatories. Kp 5 marks the G1 threshold.
A linearized measure of geomagnetic activity. It is easier to average and forecast than the quasi-logarithmic Kp index.
Bt is total interplanetary field magnitude. Bz is its north–south component in GSM coordinates; sustained negative values are often more geoeffective.
An energetic proton event measured notably above 10 MeV. Effects are stronger near the poles, at altitude and outside the magnetosphere.
A ring around the magnetic pole where particles precipitate. It expands toward lower latitudes as geomagnetic activity increases.
Sunspot number and activity follow an average cycle of about eleven years. During every cycle the Sun’s magnetic poles reverse polarity.
Space weather describes minute-to-day variations in the Sun–Earth environment. It is distinct from terrestrial weather and atmospheric climate.