
- Day
- —
- Night
- —
RADIO PROPAGATION · CURRENT DATA
RADIO CONDITIONS
A quick reading of the HF and VHF bands, backed by signals actually decoded around the selected area.
01 · HF PROPAGATION
Which bands should you try now?
A global forecast derived from ionospheric conditions. It indicates a trend, not a guarantee of a contact.
BEST BANDS · DAY—
BEST BANDS · NIGHT—
ESTIMATED RADIO NOISE—
- Day
- —
- Night
- —
- Day
- —
- Night
- —
- Day
- —
- Night
- —
02 · ACTUALLY DECODED SIGNALS
Activity around Marieville
Digital receptions reported in grid FN35 over the last 30 minutes. An active band is not necessarily the best band for every mode.
Reading PSK Reporter…
- Decodes
- —
- Countries heard
- —
- Local receivers
- —
- Leading modes
- —
These figures describe traffic decoded by participating stations; they do not measure all analog, voice or CW traffic.
03 · RADIO-RELEVANT INDICES
Sun and geomagnetic field
NOAA values confirm the propagation indicators provided by HamQSL. Measurement times are shown in EDT/EST and UTC.
RR—Radio blackouts
SS—Radiation storm
GG—Geomagnetic storm
Measurement time: —
04 · VHF PROPAGATION
Exceptional openings
A quick assessment of phenomena that can open 6 metres and higher bands beyond their usual range.
SPORADIC E · NORTH AMERICA—
AURORA · NORTHERN HEMISPHERE—
GEOMAGNETIC FIELD—
MAXIMUM USABLE FREQUENCY—
05 · QUICK READING
Understanding the indicators
Generally favours the upper HF bands, especially 20 through 10 metres, when the other indices remain quiet.
A quiet geomagnetic field supports stable HF propagation. A high Kp can disturb HF and promote VHF aurora.
Shows signals actually received near the selected area. It is practical confirmation, especially for digital modes.
HamQSL’s indicative summary. Power, antenna, time, local noise and the exact path still matter.
06 · AMATEUR-SATELLITE SERVICE
Satellite status
Two complementary references: AMSAT’s recent listening reports and SatNOGS’ open database of satellites and frequencies.
COMMUNITY REPORTSAMSAT Live OSCAR Status
See active satellites, heard beacons, missing signals and conflicting reports.
Open AMSAT ↗ OPEN DATABASESatNOGS DBBrowse satellites, modes, frequencies, transmitters and orbital elements published under an open licence.
Open SatNOGS ↗INTERNATIONAL SPACE STATION
LIVEISS position in real time
The position is recalculated every second from the latest official orbital elements.
LATITUDE—
LONGITUDE—
ALTITUDE—
SPEED—
07 · PROPAGATION ESTIMATOR
Plan a contact across every band
Select your station and target local time. The tool combines HamQSL and NOAA conditions, actual decoded activity and the usual behaviour of each band.
Indicative estimate, not a point-to-point VOACAP calculation. An engineering prediction requires both coordinates, exact antenna geometry and height, noise and effective radiated power.
RESULT VISUALIZATION
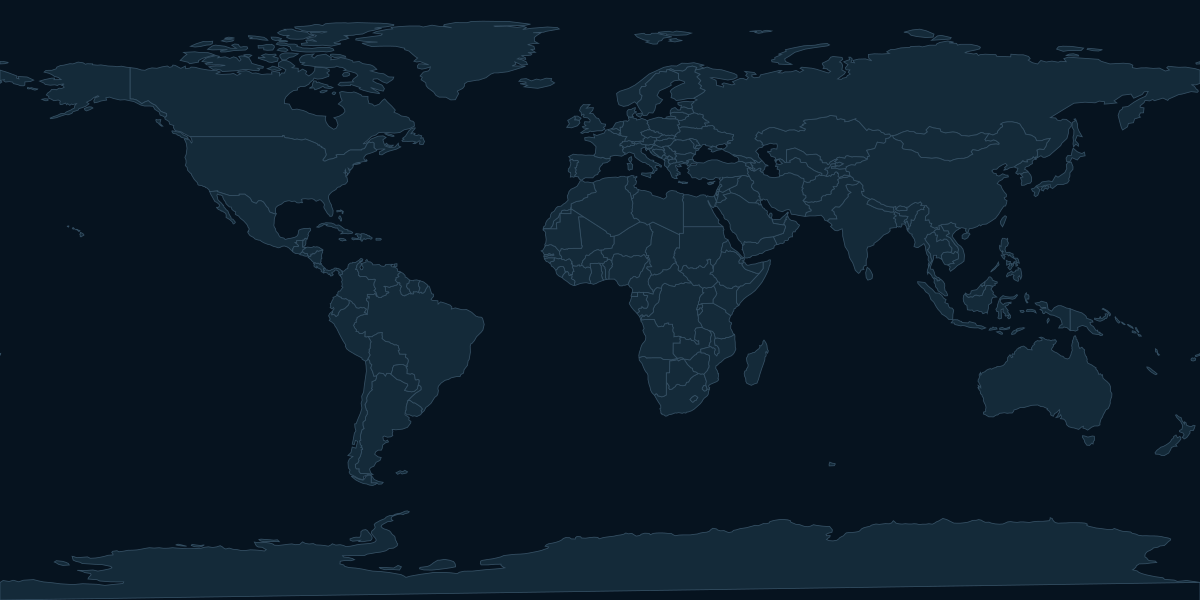
Estimated propagation map
Colour represents the relative probability calculated by the estimator for the selected area, time and station.
STRONGWEAK
Red: strongest relative probability · yellow and green: intermediate · cyan and blue: weaker. This map illustrates the estimate and is not guaranteed radio coverage.
08 · NEAR-REAL-TIME RADIO PATHS
Signals heard around Marieville
Each line is a digital reception reported by PSK Reporter during the last 30 minutes. These are decoded signals, not necessarily confirmed QSOs.